The price of encrypted assets has fallen due to the new round of regulations in various countries. But historically, encrypted assets have a strong anti-fragility. After five huge waves, the yield is still higher than other mainstream investment products. In the long run, the supervision itself will also promote the more standardized and healthy development of the blockchain industry and encrypted assets. From the perspective of the real economy, the blockchain is continuously integrating with various industries to empower. The recognition of the blockchain by governments, enterprises and the public in various countries is gradually increasing.
“Life is a trial, investment is a practice.”

Table 1: From April 14th to July 20th, Bitcoin fell from its highest point to its lowest point
Source: Trading View
On April 14, 2021, Trading View statistics showed that the price of Bitcoin climbed to a maximum of $64,854, and market sentiment reached its peak!
Three months later, on July 20, 2021, the price of Bitcoin fell to $29,278.
During this period, it experienced the global computing power without China; The late arrival of governments’ supervision, the slogan of the world environmental protection movement, the continuation of the epidemic.
In this situation, it is difficult for us to keep clam. But we are responsible for our investors and their property. Just as Jiao Wei, the excellent fund manager of Yinhua Wealthy in 2020, said, if we only look at the market, we will also doubt whether what we have done is just the mistake of a small group of survivors.
The situation of crypto assets from 2020 to 2021
The encrypted assets in 2020 has also experienced a wonderful year like other capital markets. Bitcoin reach the highest prize which more than $29,800 on the last day of 2020, with a full-year return rate of 330%. Bitcoin futures contract open interest rose from approximately $2.7 billion to approximately $9.4 billion, an increase of 248.15%. The scale of the Bitcoin Trust was expanded to $17.475 billion.
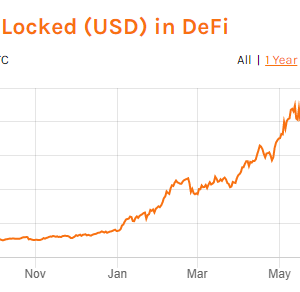
At the same time, the ecology of Ethereum has also confronted with a major explosion. Not only it achieved a 2100% increase in the amount of total volume locked positions, but also the transaction volume has increased by 41.98% year-on-year, which is nearly three times that of Bitcoin.

Table 2: Ethereum exchange supply (yellow line)
Source: Messari
Based on the data on the chain, the entire crypto market in 2021 continues the trend of 2020. And the ecology of the entire blockchain is further improved: Polkadot, BSC, Solana, Flow, Near, Polygon, Layer2…Ethereum has emerged competitors, also, Ethereum itself is constantly iterating and updating. The number of active addresses is also increasing. There are constantly new tracks joining the world, and the integration with the old field is also deepening.

Table 3: Number of active addresses in Ethereum
Source: Messari
Traditional companies are entering the market, but it will take a while before they truly understand the blockchain world. It will take a while before the world truly understands the blockchain. Just as people around the millennium did not really understand the Internet, we know what it can do, but we don’t understand it.
This is our opportunity. Time is our friend.
This report will be divided into three parts:
In the first part, we reviewed the nearly ten-year history of Bitcoin from a historical perspective and sorted out 5 rounds of bull-bear conversion, trying to illustrate that Bitcoin’s characteristics are anti-fragile.
In the second part, we horizontally compared the yields of other assets in the same period, showing that those assets that we have traditionally reached a consensus on wealth are not actually better than encrypted assets.
In the third part, if we take the present as the starting point and draw an extension of the past trend to look forward to the future, we can see a deeper integration and mutual shaping of various fields and the blockchain. From this perspective, we believe in the future has come, but has not been seen.
Bitcoin’s anti-fragility
1.Five rounds of “bull and bear” markets for Bitcoin
In 2011, Bitcoin first rose from $0.3 to $31.5. After that, it fell from US$31.5 to US$4.77 in just one and a half months, a decrease of 85%. During the entire decline, there were seven days of Bitcoin’s single-day drop of more than 20%. The entire decline process lasted 3 months before it really bottomed out.
In 2013, Bitcoin’s rise exceeded 100 times again. In April of the same year, Bitcoin fell from $266 to $54.25 within three days, a decrease of 77.4%. After several months of adjustments, Bitcoin regained lost ground and reached new highs.
At the end of 2013, Bitcoin plunged 92.5% in 83 days. This is the largest plunge in Bitcoin’s history. After that, Bitcoin entered a bear market for several years.
In September 2017, the Chinese government halted cryptocurrency trading, and the price of Bitcoin fell 37%. Then in October and November, after regaining the lost ground and setting a new high, Bitcoin began a new round of plunge. It is from a high point of close to 20,000 U.S. dollars to a 70% plunge.

Table 4: The most recent wave of “bear market” in 2021
Source: CoinMarketCap
In 2020, Bitcoin went from $5,200.37 in March to a peak of $64,854, a maximum increase of 17 times. In May 2021, due to high-pressure regulation, Bitcoin fell sharply, hitting $29,000.
2.The results of the “bull and bear” market
Bitcoin has experienced 5 plunges, and the price on August 4, 2021 was $37,763.88. Although it was down 40.16% from the peak period, it was still 2.37 times that of 1 year ago and 377637.8 times that of 11 years ago.

Table 5: Bitcoin price trend in 2013-2021
Source: CoinMarketCap
3.Bitcoin anti-fragility
Bitcoin, as the representative asset of the blockchain, has the characteristics of all blockchain assets, the most important of which is anti-fragility.
The vitality of the blockchain comes from openness and competition. For a decentralized autonomous system to be viable, it must be as open as possible, and lower the threshold as much as possible to allow more people to participate. The greater the number of participants, the fiercer the competition, the more dynamic the system, and the stronger the anti-fragility.
Blockchain can meet the real needs of users and gain support from users. Users can satisfy most users’ needs through mechanisms such as community governance and voting. The closer the connection with users, the more dynamic the blockchain, and the more anti-fragile.
Blockchain is a free market, a market that is decentralized to the greatest extent, and each individual can play games according to their own purposes. Therefore, the short-term market will have greater volatility, but it has strong anti-fragility in the long-term.
Comparison of crypto assets with other mainstream assets
Gold
Gold has risen 46.45% from 1,238.31 USD/oz in August 2010 to 1,813.5 USD/oz in August 2021.

Table 6: Gold price trend from 2010 to 2021
Source: TradingView
Stock
Amazon’s stock price increased 27.23 times from US$117.89 in August 2010 to US$3,327.59 in August 2021.
The Nasdaq Composite Index (IXIC) increased 6.05 times from USD 2,114 in August 2010 to USD 1,4895.1 in August 2021.

Table 9: Amazon stock price trend from 2010 to 2021
Source: TradingView

Table 10: Nasdaq Composite Index Trend from 2010 to 2021
Source: TradingView
Comparison of return rates of major investment projects
In the current major investment projects, such as gold, stocks, etc., the yields of cryptocurrencies such as Bitcoin and Ethereum are much higher than other investment projects. Even if Bitcoin has experienced several huge rises and falls, it can still bring huge benefits, and it is tens of thousands to tens of millions of times that of other investment projects. Secondly, according to the Sharpe ratio of each item, Bitcoin has the characteristics of high risk and high return.
Note: According to the definition of MBA Think Tank Encyclopedia, the Sharpe ratio = (expected rate of return-risk-free interest rate)/standard deviation, where the risk-free interest rate is the 10-year Treasury bonds of the United States. The standard deviation method is to select the price of the last day of each year from 2010 to 2020 and find the standard deviation of these 11 prices.

Table 11: Comparison of return rates of major investment projects